Article Archives
- February 2024
- January 2024
- September 2023
- August 2023
- July 2023
- May 2023
- April 2023
- March 2023
- February 2023
- November 2022
- October 2022
- September 2022
- August 2022
- July 2022
- June 2022
- May 2022
- February 2022
- January 2022
- November 2021
- October 2021
- September 2021
- August 2021
- July 2021
- June 2021
- May 2021
- April 2021
- March 2021
- February 2021
- January 2021
- December 2020
- November 2020
- October 2020
- September 2020
- August 2020
- July 2020
- June 2020
- May 2020
- April 2020
- March 2020
- February 2020
- January 2020
- December 2019
- November 2019
- October 2019
- September 2019
- August 2019
- July 2019
- June 2019
- May 2019
- April 2019
- March 2019
- February 2019
- January 2019
- December 2018
- November 2018
- October 2018
- September 2018
- August 2018
- July 2018
- June 2018
- May 2018
- April 2018
- March 2018
- February 2018
- January 2018
- December 2017
- November 2017
- October 2017
- September 2017
- August 2017
- July 2017
- June 2017
- April 2017
- February 2017
- January 2017
- December 2016
- November 2016
- October 2016
- September 2016
- August 2016
- July 2016
- June 2016
- January 2016
- December 2015
- November 2015
- October 2015
- September 2015
- August 2015
- July 2014
- June 2014
- May 2014
- April 2014
- March 2014
- September 2013
- April 2013
- March 2013
- October 2012
- All Current Articles
Article Categories
- Awards & Grants
- Bio Fuels
- Case Studies
- Clean Cities and Communities
- Clean Fuels Events - National/Regional
- Clean Fuels Events - Statewide
- Clean Fuels Funding
- Clean Fuels Infrastructure
- CNG
- Electric Vehicles
- Emissions & Fuel Economy
- Energy Efficient Mobility Systems (EEMS)
- EPA Advance Program
- Home Page
- Hydrogen Fuel Cell
- LCF Members
- LCF Press Releases
- Louisiana Department of Environmental Quality
- Louisiana News
- National News
- News
- Office of Critical Minerals and Energy Innovation
- Propane
- Tax Incentives
- Technical Workshops
- Webinar
- All Current Articles
Clean Fuel News
Benefits and Opportunities of Natural Gas Use, Transportation, and Production
This new study, conducted by ICF, examined the economic benefits and opportunities from the entire natural gas value chain including the production of natural gas, its transportation and end uses. A unique feature of this report is that it defines the natural gas value chain as going “all the way through consumption” to include the economic activity from natural gas as a feed stock for other products and useful energy services.
INTRODUCTION
This report describes how natural gas and its associated liquids (lease condensate and natural gas plant liquids) contribute to the U.S. economy both at a national level and in terms of the economies of individual states. The economic contribution is estimated for the historical year of 2015 and is projected to 2040 under three scenarios drawn from EIA’s AEO.
SCOPE
Economic impacts are measured in terms of the number of jobs that are supported, the wages paid for those jobs, and the total value added (that is, the contribution to the national GDP and to its constituent state products). A unique feature of this report is that it defines the natural gas value chain as going “all the way through consumption” to include the economic activity of converting the natural gas to other products and useful energy services.
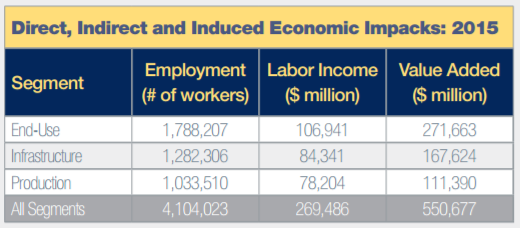
BASE YEAR RESULTS
Shown below are the job counts, wages and value added by three segments of the natural gas value chain: “end use,” “infrastructure,” and “production.” The end use segment is made up of the industries that convert natural gas and its associated liquids to electricity, petrochemical and other products and the industries that manufacture, sell, install and maintain gas-fired appliances and equipment used in the residential, commercial, vehicle and industrial sectors.
The end use segment is the largest of the three with 44% of the total jobs. The infrastructure segment— which is made up of gatherers, gas processing, petroleum refining, natural gas distribution, and propane distribution— contributes 31% of the 2015 total jobs. The production segment— consisting of oil and gas production companies and their suppliers of goods and services— contributes the remaining 25% of 2015 total natural gas value chain jobs.
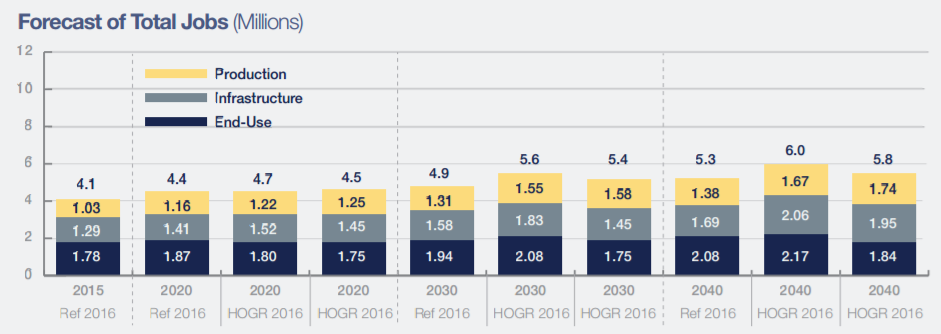
Estimates for total jobs (direct, indirect and induced) through 2040 are shown below for the three AEO cases. The growth rate in employment for the Reference Case is 1.0% per year from 2015 to 2040 when total jobs reach 5.3 million. Due to the increased amount of oil and gas produced and consumed in 2016 High Oil and Gas Resource Case, the rate of growth in employment is higher in that case at 1.6% per year. By 2040 there are 0.8 million more jobs compared to the Reference case.FORECAST RESULTS
EXPORTS
The natural gas value chain contributes substantially to U.S. exports of commodities. In 2015 gas-related exports totaled over $37.6 billion. This includes primary hydrocarbons, refined petroleum products, petrochemicals, fertilizers, plastics and resins. The fastest growth in natural gas value chain exports are expected to be in LNG exports and petrochemicals with substantial growth also expected in pipeline natural gas and NGLs. Such exports are expected to grow at annual rates of 3.4% to 3.8% per year, which is 60% to 70% faster than the overall natural gas value chain.
The 2015 High Oil and Gas Resource Case falls in between the other two cases with an average growth rate in total employment of 1.4% per year. The results for wages show similar tends among the three cases. The forecasted direct, indirect and induced value added for all three segments combined grows from $550 billion in 2015 to $902 billion in the Reference Case, an annual growth rate of 2.0%. The 2016 High Oil and Gas Resource Case has a higher growth rate of 2.3% per year and reaches $980 billion by 2040. The 2015 High Oil and Gas Resource Case also grows faster (2.3% per year) than the Reference Case and reaches $962 billion by 2040.
CONCLUSION: The natural gas value chain touches all states and a large number of industrial sectors supporting 2.9% of all non-farm jobs and contributing 3.1% of the national economy (GDP). These contributions to the U.S. economy are expected to grow in the future under each of the AEO scenarios examined here.
Full Report: Benefits and Opportunities of Natural Gas Use, Transportation, and Production
Summary: Benefits and Opportunities of Natural Gas Use, Transportation, and Production